Deep dive
Debugging the node editor
Introduced in v0.7.1-beta.1 · Verified in v0.41.0
Two failures made the same canvas feel broken: a React feedback loop and CPU-heavy rendering. The first required clearer state ownership; the second, a narrow worker boundary.
Manual performance comparison
Measured locally- Heavy graph edits
- 8–12 FPS
- After noise worker
- ≥57 FPS
- Workloads moved
- 2
A directional measurement
The FPS figures compare the same kind of heavy interaction during local profiling. They are evidence of the bottleneck shift, not a device-independent guarantee.
A maintained measurement path
The benchmark now separates frames, long tasks, thumbnails, document and layer renders, worker work, and GPU phases before another boundary moves.
Interpretation. In local testing, moving noise generation off the main thread restored responsive editing. The benchmark now helps judge later optimizations by the bottleneck they actually change.
Two failures, one surface
Introduced in v0.7.1-beta.1 · Verified in v0.41.0
The node editor failed twice in ways that looked similar: first it entered an update loop; later it stayed correct but fell to 8–12 FPS under heavy render work.
I almost abandoned the first Nodes prototype when React began reporting Maximum update depth exceeded. The canvas could enter a feedback loop while React Flow measured custom node contents and the controlled node list rebuilt around those measurements. This was a state bug: moving the work to another thread would not have stopped the loop.
Later, the graph stayed correct but felt slow under heavy render work. Procedural textures and CPU image effects occupied the main thread while the same thread was expected to process input, update React Flow, and compose previews. That was a throughput problem. Similar symptoms did not justify one shared fix.
The surface both problems affected
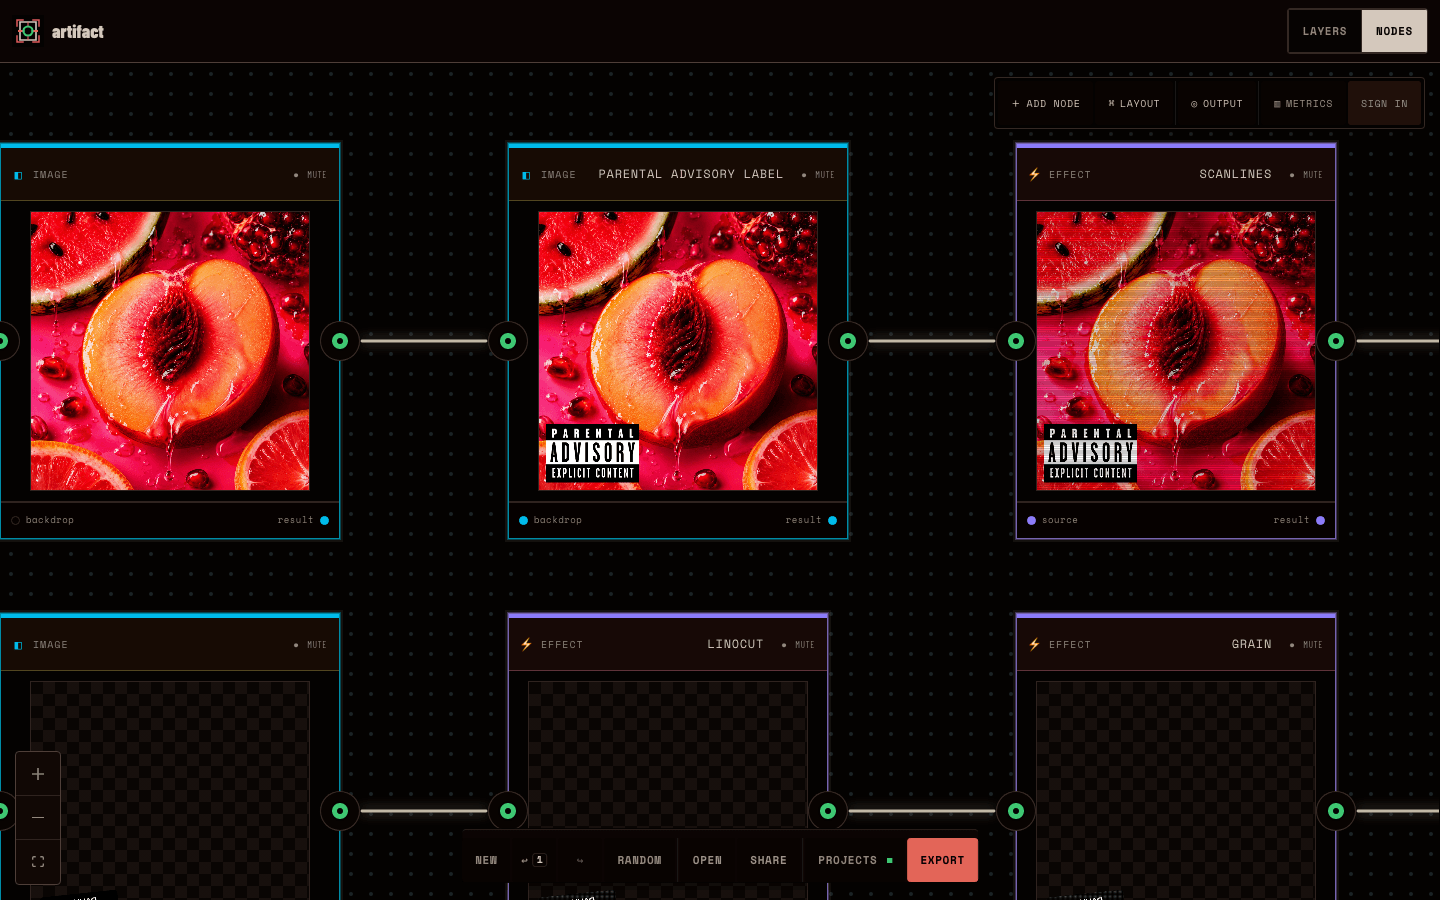
A real graph with visible intermediate results
The “Сочная и влажная” document makes the workload visible: each node has a live preview, so editing one composition can trigger both graph updates and image processing.
Why it matters. The graph is not only a diagram. Live previews bring interaction state and rendering cost onto the same surface, even though the editor must manage them separately.
Stop the update loop
Introduced in v0.7.1-beta.1 · Verified in v0.41.0
The stability fix let React Flow keep measuring nodes while filtering out reports that changed nothing.
React Flow needs real dimension changes to initialize bounds and handles, so ignoring every measurement was not safe. Artifact instead compares each dimension report with the node’s current measured size and resizing state. Equivalent reports are discarded; genuine size, position, and selection changes continue.
The regression tests preserve that distinction: duplicate dimensions become no-ops while real measurements and interactions remain observable. The fix is small because the ownership rule is explicit: a repeated layout measurement is not a new document edit.
The stability path
React Flow measures a node
Custom node content can cause repeated dimension reports as previews and overlays settle inside a controlled graph.
Compare with the measured state
The change handler compares the reported width, height, and resizing state with the node already held by React Flow.
Drop duplicate dimensions
A no-op measurement stops before it can rebuild the controlled node list and trigger another equivalent measurement.
Keep real interaction live
Real size changes, selection, and position updates continue through the normal path, preserving handles and drag behavior.
Why it matters. The editor can remain controlled without turning every repeated measurement into another render cycle. Real interaction stays live because the filter is based on equality, not change type alone.
Move only the pixel work
Introduced in v0.7.1-beta.1 · Verified in v0.41.0
The performance fix moved only deterministic pixel work to workers; editor state and the rendering contract stayed put.
Manual profiling identified procedural-noise generation as the first pure CPU workload worth isolating. In the same local profiling scenario, moving it to a dedicated Web Worker raised heavy interaction from roughly 8–12 FPS to roughly 57 FPS or higher. A second boundary later moved CPU-only image-data effects through the same pattern.
Only serializable settings and transferable pixel buffers cross those boundaries. React Flow state, DOM events, canvas creation and composition, PixiJS filters, and live Three.js viewports remain on the main thread. The worker clients can call the same pure implementation on the main thread in tests, unsupported environments, failures, and timeouts, so worker availability does not create a second rendering model.
The worker boundary
Main thread
React Flow state, DOM events, canvas composition, PixiJS filters, and live Three.js viewports stay with the browser UI.
Pure pixel functions
Deterministic noise generation and CPU-only image-data effects are isolated from document state and canvas ownership.
Dedicated workers
Serializable settings and transferable pixel buffers cross the boundary; the worker returns pixels rather than editor objects.
One implementation, two execution paths
Tests, unsupported environments, worker failures, and timeouts can run the same pure function on the main thread.
Why it matters. The worker improves responsiveness without putting canvases, WebGL objects, React state, or other non-serializable values into CanvasDocument. Preview and export keep one rendering contract.
Measure the next boundary
Introduced in v0.7.1-beta.1 · Verified in v0.41.0
A repeatable benchmark now helps locate the next slow interaction in graph state, thumbnails, document rendering, a pixel function, or a GPU phase.
The local Playwright benchmark loads a synthetic graph, waits for its previews, then drags a node, changes an effect slider, and pans the canvas. It records frame timing and long tasks alongside thumbnail, document, layer, worker, and GPU measures. The report is designed for relative build comparisons rather than a universal score.
That distinction keeps future optimization honest. Initial-load work can still come from image decoding, a full-quality canvas pass, thumbnail scheduling, or GPU effects. The next change should follow the slow phase in repeated measurements instead of assuming that more worker boundaries are automatically better.
What the benchmark exercises
Initial node load
Tracks preview preparation, document renders, thumbnail phases, long tasks, and graph size.
Drag and pan
Separates graph interaction timing from expensive render work that happens around the canvas.
Effect changes
Changes a live slider repeatedly so frame timing can be compared with layer, worker, and GPU measures.
Relative comparison
Two builds are compared over repeated runs because browser timing depends on the machine.
Why it matters. The benchmark connects a visible interaction to the subsystem doing the work. That makes a targeted optimization easier to defend and a regression easier to locate.
Implementation and measurement evidence
- Performance benchmark guide (opens in new tab)
The maintained profiling notes, worker boundaries, benchmark interpretation, and manual before-and-after figures.
- Stable React Flow changes (opens in new tab)
The controlled-node comparison that rejects duplicate dimensions while retaining real interaction changes.
- Node-change regression tests (opens in new tab)
Focused coverage for duplicate measurements, real resizing, selection, position, and retained node dimensions.
- Node-editor benchmark harness (opens in new tab)
The Playwright workflow that records frames, long tasks, thumbnail phases, document and layer renders, and GPU phases.
- Render worker implementation (opens in new tab)
The pure noise and CPU effect kernels, dedicated worker entry points, client fallbacks, diagnostics, and tests.
Why it matters. Together, these sources trace the work from the original symptom to the regression test, benchmark, and current worker implementation.